Broadwater Channel Monitoring
The information shown is part of an ongoing Broadwater monitoring program. Survey data will be constantly updated as surveys are completed. Check individual survey boundary areas for currency.
-
Help
The information on these maps have been collected through the use of high quality, wide swath hydrographic survey equipment. Total ensonification of the seabed has been achieved with a 1m grid for each of these surveys. Surveys are not to class however rigorous checks are carried out each time to ensure high accuracy. For further information please Contact Us.
Survey dates are available by clicking anywhere within the survey boundary for the area you are interested in. The most recent survey data is always shown.
Information is zoom layered such that more detail will appear as the map is zoomed in.
All depths are to LAT (Lowest Astronomical Tide) datum based on the published MSQ semidiurnal tidal planes.
Soundings are shown in metres and decimetres.
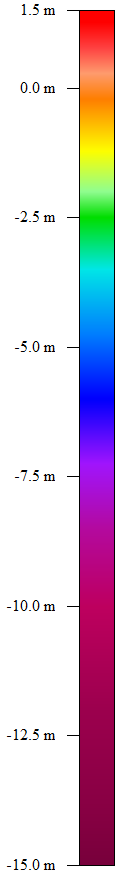
The graduated colour map shown provides a visual guide to depth. A scale is shown below.